プログラミング入門II
2025.07.02
matplotlib
Back to index page
- 本日の作業内容
- 前回の宿題について
大体の人が今回もできていました.もちろんやり方はいくつもあるので,解答例と違うものでもちゃんとできているものが多かったです.ただ,エラーになるものがあったのは残念です.単純なミスなのですが,自分で実行して気づかないのでしょうか.
実行時エラー: 24_28
名前と番号,全部違う: 24_01
以下は例によって問題のあるプログラムの例です.参考にしてください.
with open('THE_CONSTITUTION_OF_JAPAN.py') as f:
|
読み込むファイル名が違いますね.
print(f"{letter}: {lst[i]}")
|
今回はこの桁数指定をしないものが多くみられました.これまでの課題のレビューでも出てくるたびに毎回指摘しているのですが,なかなかなくなりません.今回は大幅減点にしました.
A: 107
B: 13
C: 46
D: 51
E: 207
F: 36
G: 20
H: 86
I: 117
J: 8
K: 2
L: 73
M: 17
N: 113
O: 125
P: 57
Q: 0
R: 96
S: 92
T: 140
U: 39
V: 24
W: 32
X: 2
Y: 18
Z: 1
|
|
alphabet = ['A', 'B', 'C', 'D', 'E', 'F', 'G', 'H', 'I', 'J','K', 'L', 'M', 'N', 'O', 'P', 'Q', 'R', 'S', 'T','U', 'V', 'W', 'X', 'Y', 'Z']
|
こういう面倒なことはしない方がいいですね.
|
text = """
THE CONSTITUTION OF JAPAN
We, the Japanese people, acting through our duly elected representatives in the National Diet, determined that we shall secure for ourselves and our posterity the fruits of peaceful cooperation with all nations and the blessings of liberty throughout this land, and resolved that never again shall we be visited with the horrors of war through the action of government, do proclaim that sovereign power resides with the people and do firmly establish this Constitution. Government is a sacred trust of the people, the authority for which derived from the people, the powers of which are exercised by the representatives of the people, and the benefits of which are enjoyed by the people. This is a universal principle of mankind upon which this Constitution is founded. We reject and revoke all constitutions, laws, ordinances and the prescripts in conflict herewith.
We, the Japanese people, desire peace for all time and are deeply conscious of the high ideals controlling human relationship, and we have determined to preserve our security and existence, trusting in the justice and faith of the peace-loving peoples of the world. We desire to occupy an honored place in an international society striving for the preservation of peace, and the banishment of tyranny and slavery, oppression and intolerance for all time from the earth. We recognize that all peoples of the world have the right to live in peace, free from fear and want.
We believe that no nation is responsible to itself alone, but that laws of political morality are universal; and that obedience to such laws is incumbent upon all nations who would sustain their own sovereignty and justify their sovereign relationship with other nations.
We, Japanese people, pledge our national honor to accomplish these high ideals and purposes with all our resources.
"""
|
今回の内容はファイルを読み込むところがポイントなのに,ソース内にテキストを置いたらダメです.
filtered = list(filter(lambda item: item[1] > 0, char_freq.items()))
|
値があるものだけを頻度のリストに入れてしまったので,以下のように一回も登場しない Q の項目が抜け落ちています.
A: 107
B: 13
C: 46
D: 51
E: 207
F: 36
G: 20
H: 86
I: 117
J: 8
K: 2
L: 73
M: 17
N: 113
O: 125
P: 57
R: 96
S: 92
T: 140
U: 39
V: 24
W: 32
X: 2
Y: 18
Z: 1
|
f = open('THE_CONSTITUTION_OF_JAPAN.txt', 'r', encoding='utf-8')
while True:
    line = f.readline()
    if not line:
        break
    print(line, end='')
    text += line
f.close()
|
余分な print があるので,実行結果が見づらくなってしまいます.
前回の復習
ファイル処理について,CSV形式で保存されているテキストデータの読み込みや,計算結果のCSVへの書き出しを学習しました.卒業研究などでの測定データの処理などに発展する内容ですので,今回の内容も含めてしっかり基本を押さえておきましょう.
matplotlib
matplotlib とは Python で図を描画するためのライブラリです.機能が豊富で,さまざまな図の描画が可能ですが,この授業では簡単なグラフの描画に限定して説明していきます.最近では Matplotlib よりも洗練された多機能のライブラリもあるようですが,定番と言えば Matplotlib なので,これを扱っていきましょう.
- グラフ作成の仕組み
matplotlib では最初にグラフの枠組みとなる描画領域などのオブジェクトを生成し,続いてオブジェクトの要素であるグラフの線や凡例などを追加していくという仕組みになっています.
枠組みとしてのオブジェクトには枠組みとしての Figure,グラフ描画部分を表す Axes そして軸などの Axis があります.
- 流儀
ややこしいことに matplotlib でグラフを描画するのに2つの流儀があります.どちらでもグラフの描画が可能です.一つは「オブジェクト指向スタイル」でもう一つが「MATLAB流」です.MATLAB経験者にとってはMATLAB風が良いのかもしれませんが,この授業ではオブジェクト指向のスタイルで説明していきます.
- グラフ描画の基本
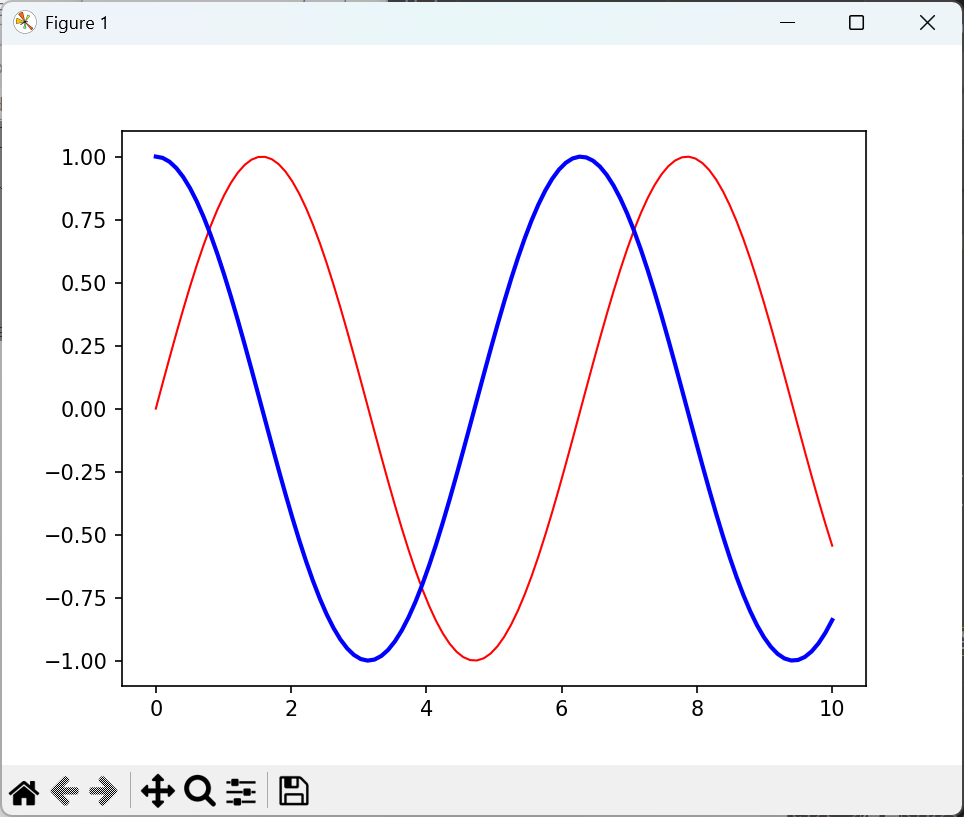
とりあえず感触を試すために,基本的な関数である sin x と cos x のグラフを作ってみましょう.numpy がすでにインストールされている前提ですが,以下のスクリプトを実行してみてください.
import numpy as np
import matplotlib.pyplot as plt

x = np.linspace(0, 10, 100)

fig, ax = plt.subplots()

ax.plot(x, np.sin(x), color='r', linewidth=1)
ax.plot(x, np.cos(x), color='b', linewidth=2)

plt.show()
|
実行すると,以下のような画面が表示されると思います.
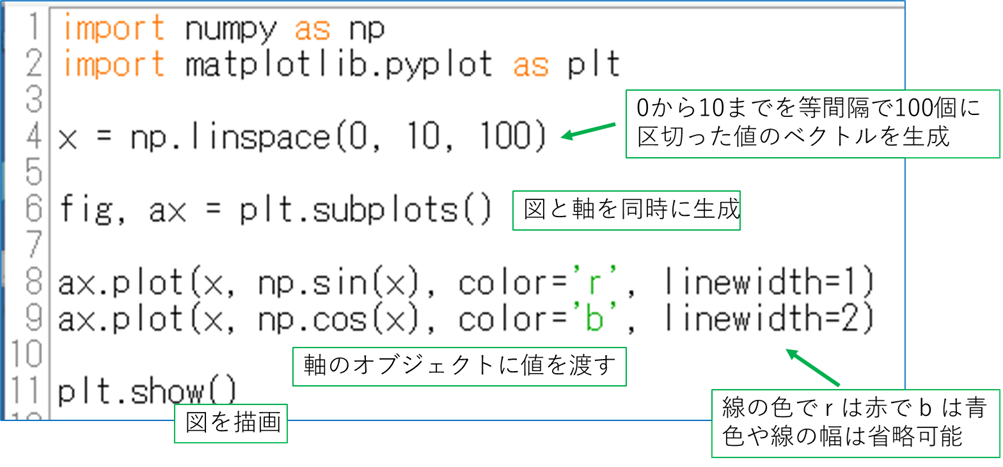
まず import 文ですが,numpy は略称として np を使用し,matplotlib は plot を使うということがお約束ですので,そこは勝手な名前にはしないでください.その他の説明は下図のようになります.
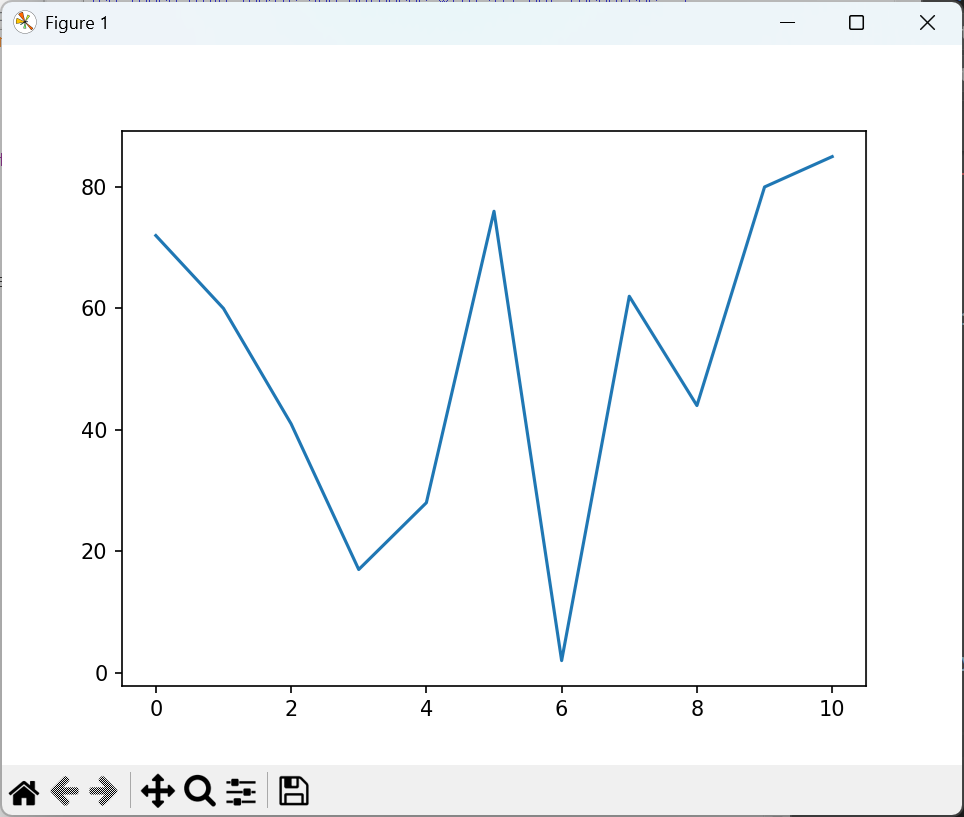
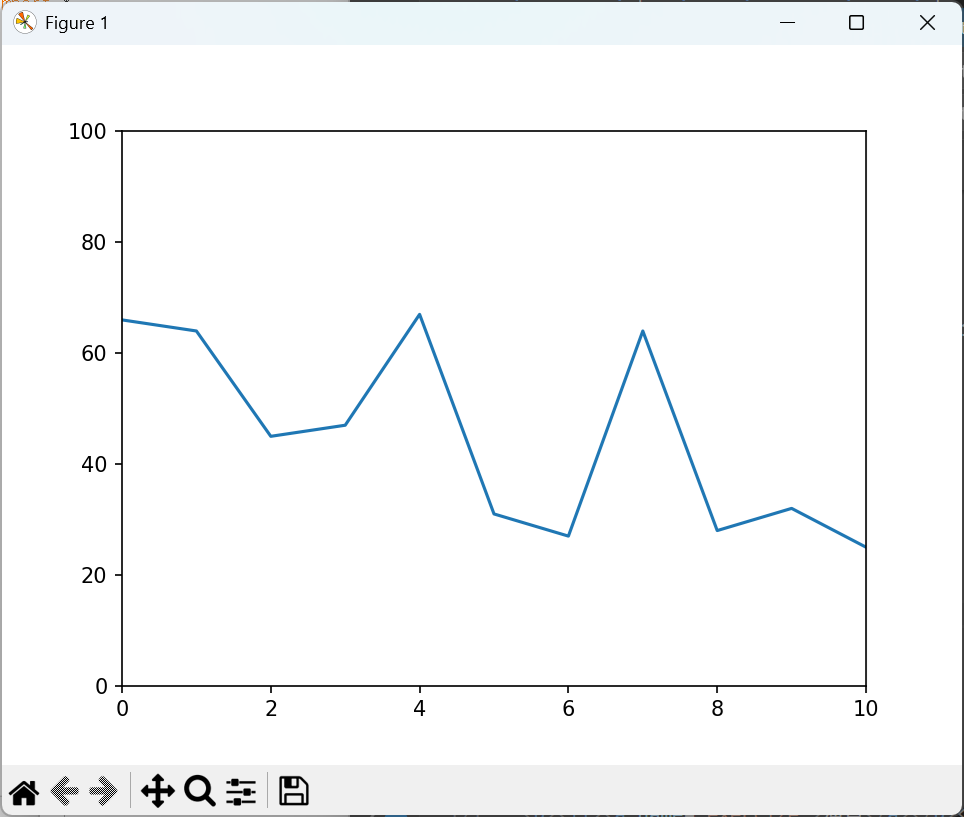
- リストデータのグラフ化
リストの内容をグラフにするためには,特に難しいことをする必要はありません.以下のようにプロット指せるだけです.
import matplotlib.pyplot as plt
from random import randint as randi

xlst = [i for i in range(11)]
ylst = [randi(1, 100) for _ in range(11)]

print(*ylst)

fig, ax = plt.subplots()

ax.plot(xlst, ylst)

plt.show()
|
72 60 41 17 28 76 2 62 44 80 85
|
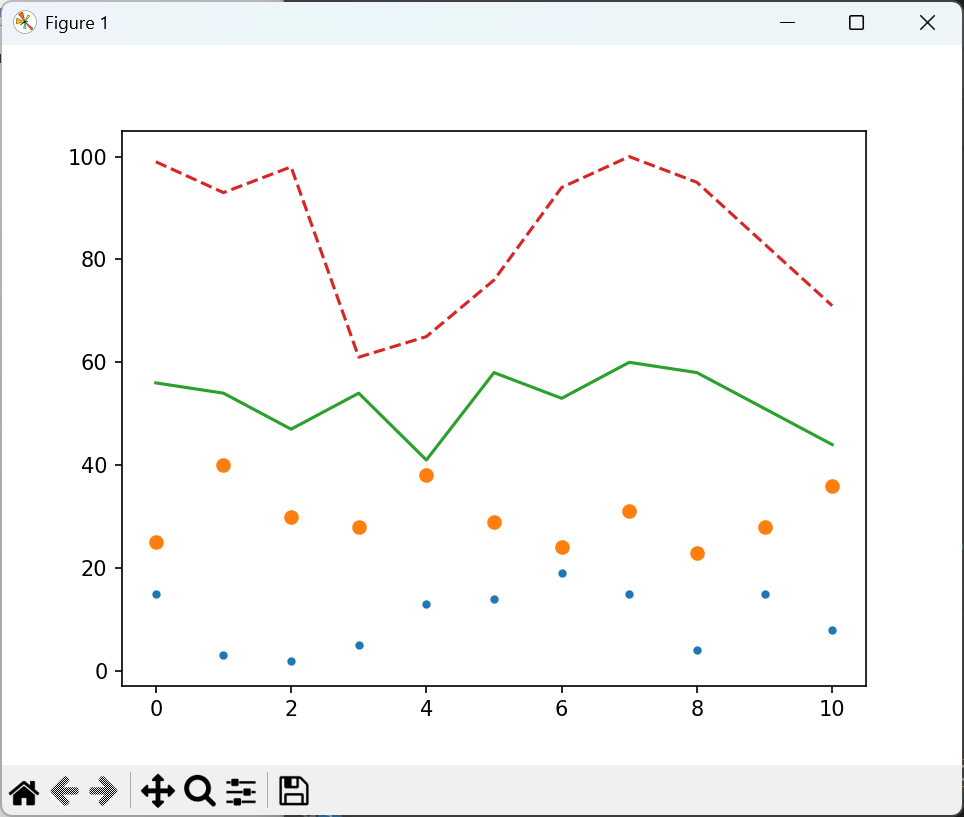
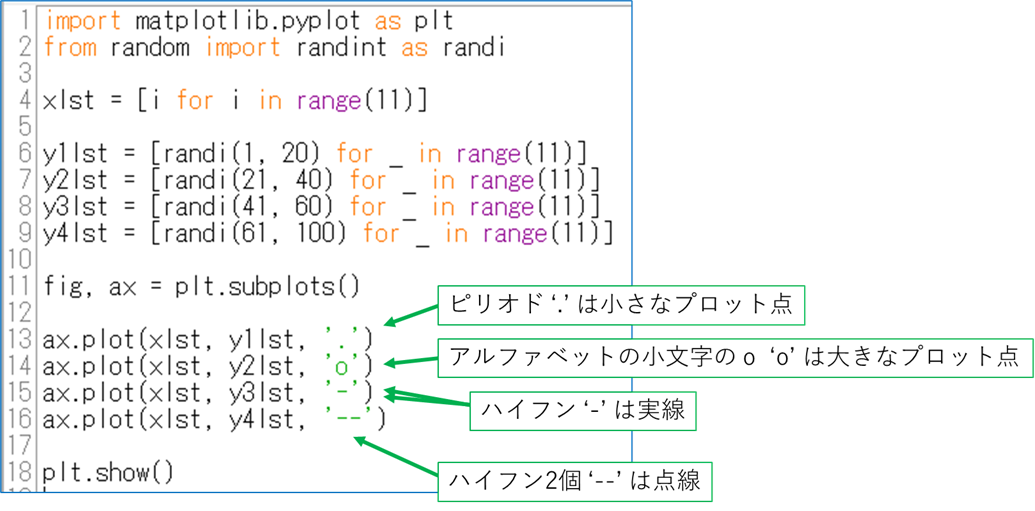
- プロットの点や線の指定
プロット点なども以下のように指定することで変更できます.
import matplotlib.pyplot as plt
from random import randint as randi

xlst = [i for i in range(11)]

y1lst = [randi(1, 20) for _ in range(11)]
y2lst = [randi(21, 40) for _ in range(11)]
y3lst = [randi(41, 60) for _ in range(11)]
y4lst = [randi(61, 100) for _ in range(11)]

fig, ax = plt.subplots()

ax.plot(xlst, y1lst, '.')
ax.plot(xlst, y2lst, 'o')
ax.plot(xlst, y3lst, '-')
ax.plot(xlst, y4lst, '--')

plt.show()
|
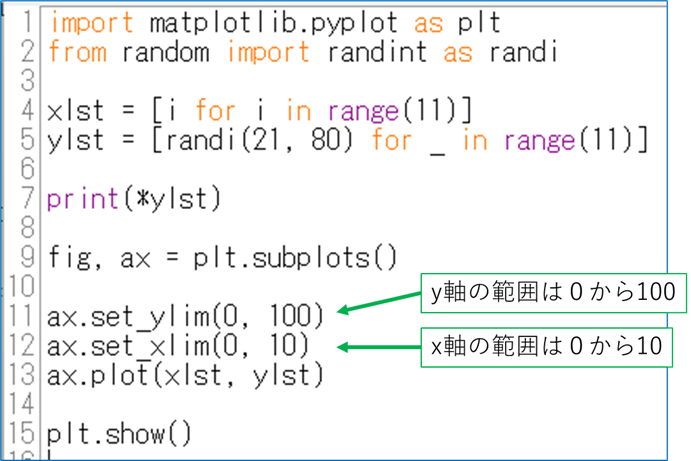
- 座標軸のラベル
matplotlib ではグラフに描画する座標データに応じて縦軸と横軸の数値を自動で割り当ててくれます.自分で値を固定値にすることも可能です.
import matplotlib.pyplot as plt
from random import randint as randi

xlst = [i for i in range(11)]
ylst = [randi(21, 80) for _ in range(11)]

print(*ylst)

fig, ax = plt.subplots()

ax.set_ylim(0, 100)
ax.set_xlim(0, 10)
ax.plot(xlst, ylst)

plt.show()
|
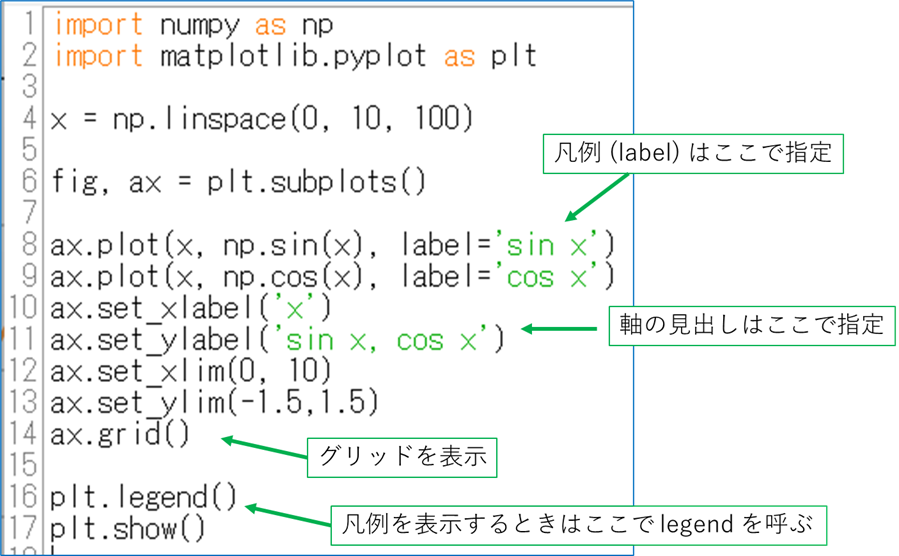
- 凡例とキャプションの付与
グラフを描く際には縦軸と横軸の物理量が何なのかを必ず書くよう学生実験でも指導されていると思います.そこで,グラフに凡例と量を説明するキャプションを入れましょう.
import numpy as np
import matplotlib.pyplot as plt

x = np.linspace(0, 10, 100)

fig, ax = plt.subplots()

ax.plot(x, np.sin(x), label='sin x')
ax.plot(x, np.cos(x), label='cos x')
ax.set_xlabel('x')
ax.set_ylabel('sin x, cos x')
ax.set_xlim(0, 10)
ax.set_ylim(-1.5,1.5)
ax.grid()

plt.legend()
plt.show()
|
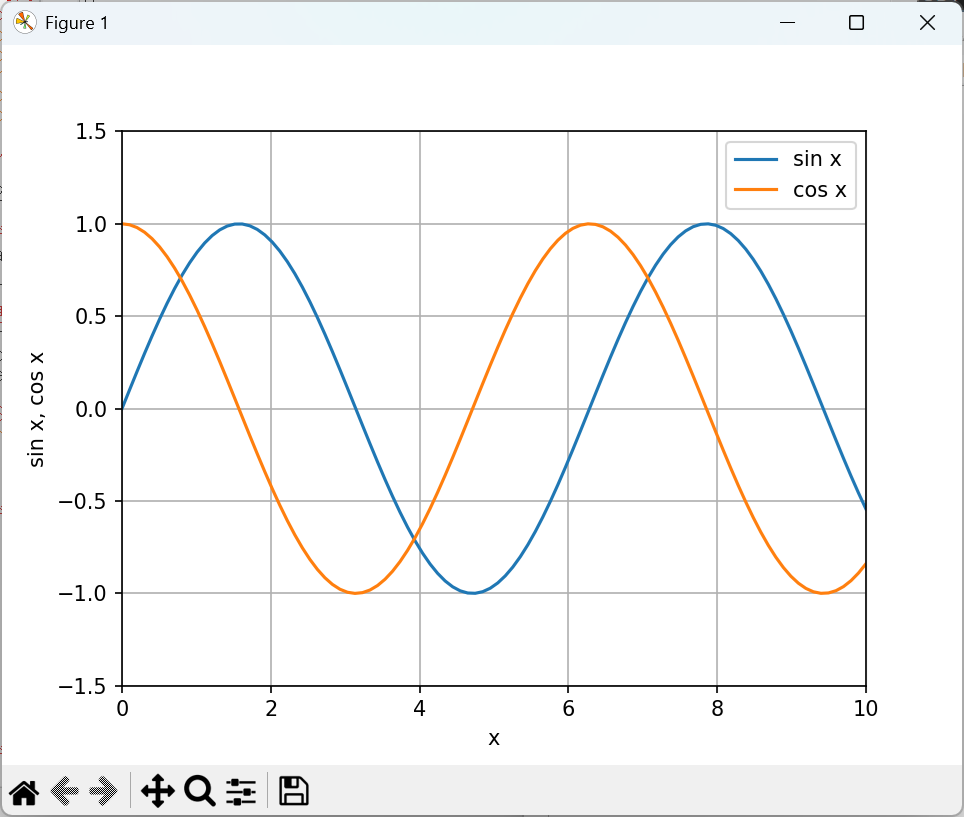
上の結果のグラフのように,今回軸のキャプション,凡例,そしてグリッドを追加しました.
演習
今回の演習問題です.
宿題
今回は宿題を課しません.が,演習問題をじっくりと見直して,Matplotlib を使えるようになっておいて下さい.
次回の予習
次回も Matplotlib を使用したグラフの描画について学習します.
目次ページに戻る